Sugar Cane Testing & Analysis
Ensure the highest quality and yield from your sugar cane crops with our comprehensive testing services. Our state-of-the-art lab specializes in analyzing sugar content (Brix), purity, fiber levels, and other key indicators critical for maximizing efficiency and profitability in sugar production.
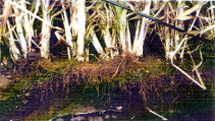
Control
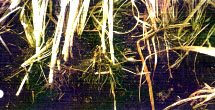
Treated
Let op wortel en stok ontwikkeling. Note root- and stem development.
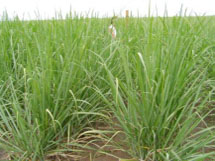
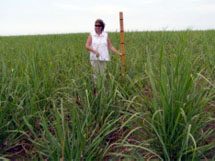
Sugarcane Results: Zululand

1: Umfolozi – 10 months | 2: Hillside Nkwaleni – 8 months | 3: Nkwaleni Untreated
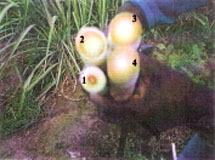
Notice steady improvement on cell division and juice flow from 1 to 4
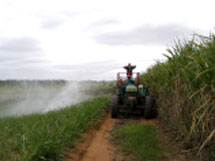
Application: Young cane
Sugar Cane Tests #1
Date Planted: 2 April 2003
Germination: 2 weeks ahead of control
Date of this Report: 25 November 2003
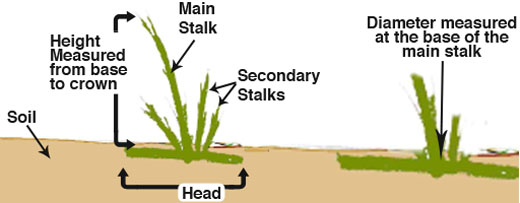
| Plot No.: | Height (cm): | Diameter at base of main stalk (mm) | Total number of stalks | Compound Average (%) |
|---|---|---|---|---|
| 21: Bio Terra | 580 – 680 | 28 – 30 | 234 | |
| Average | 630 | 29 | ||
| 23: Control | 460 – 500 | 23 – 25 | 116 | |
| Average | 480 | 24 | ||
| % Diff on Average | 31% | 20% | 101% | 506,00 |
| 30: Bio Terra | 680 – 770 | 29 – 36 | 299 | |
| Average | 725 | 32.5 | ||
| 31: Control | 630 – 680 | 22 – 28 | 161 | |
| Average | 655 | 25 | ||
| % Diff on Average | 10.60% | 30% | 85.70% | 421,00 |
Sugar Cane Tests #1
Date Planted: 2 April 2003
Germination: 2 weeks ahead of control
Date of this Report: 25 November 2003
| Plot No.: | Height (cm): | Diameter at base of main stalk (mm) | Number of Heads | Total number of Stalks | Compound Average (%) |
|---|---|---|---|---|---|
| 21: Bio Terra | 27 – 30 | 22 – 24 | 19 | 92 | |
| Average | 28.5 | 23 | |||
| 23: Control | 22 – 28 | 17 – 19 | 14 | 66 | |
| Average | 25 | 18 | |||
| % Diff on Average | 14% | 21.70% | 101% | 50% | 285,00 |
| 30: Bio Terra | 27 – 35 | 25 – 29 | 299 | 151 | |
| Average | 31 | 27 | |||
| 31: Control | 22 – 34 | 20 – 25 | 161 | 89 | |
| Average | 28 | 22.5 | |||
| % Diff on Average | 10.70% | 20% | 85.70% | 69.60% | 3.343,00 |
Treated: February 2007
Control